A fleet dashboard for the Linux boxes
you actually run yourself.
Built for bare-metal Linux operators who don't want to stand up another observability platform.
< 3 min install · MIT licensed agent · SQLite export on every tier · Free up to 3 hosts
What it looks like
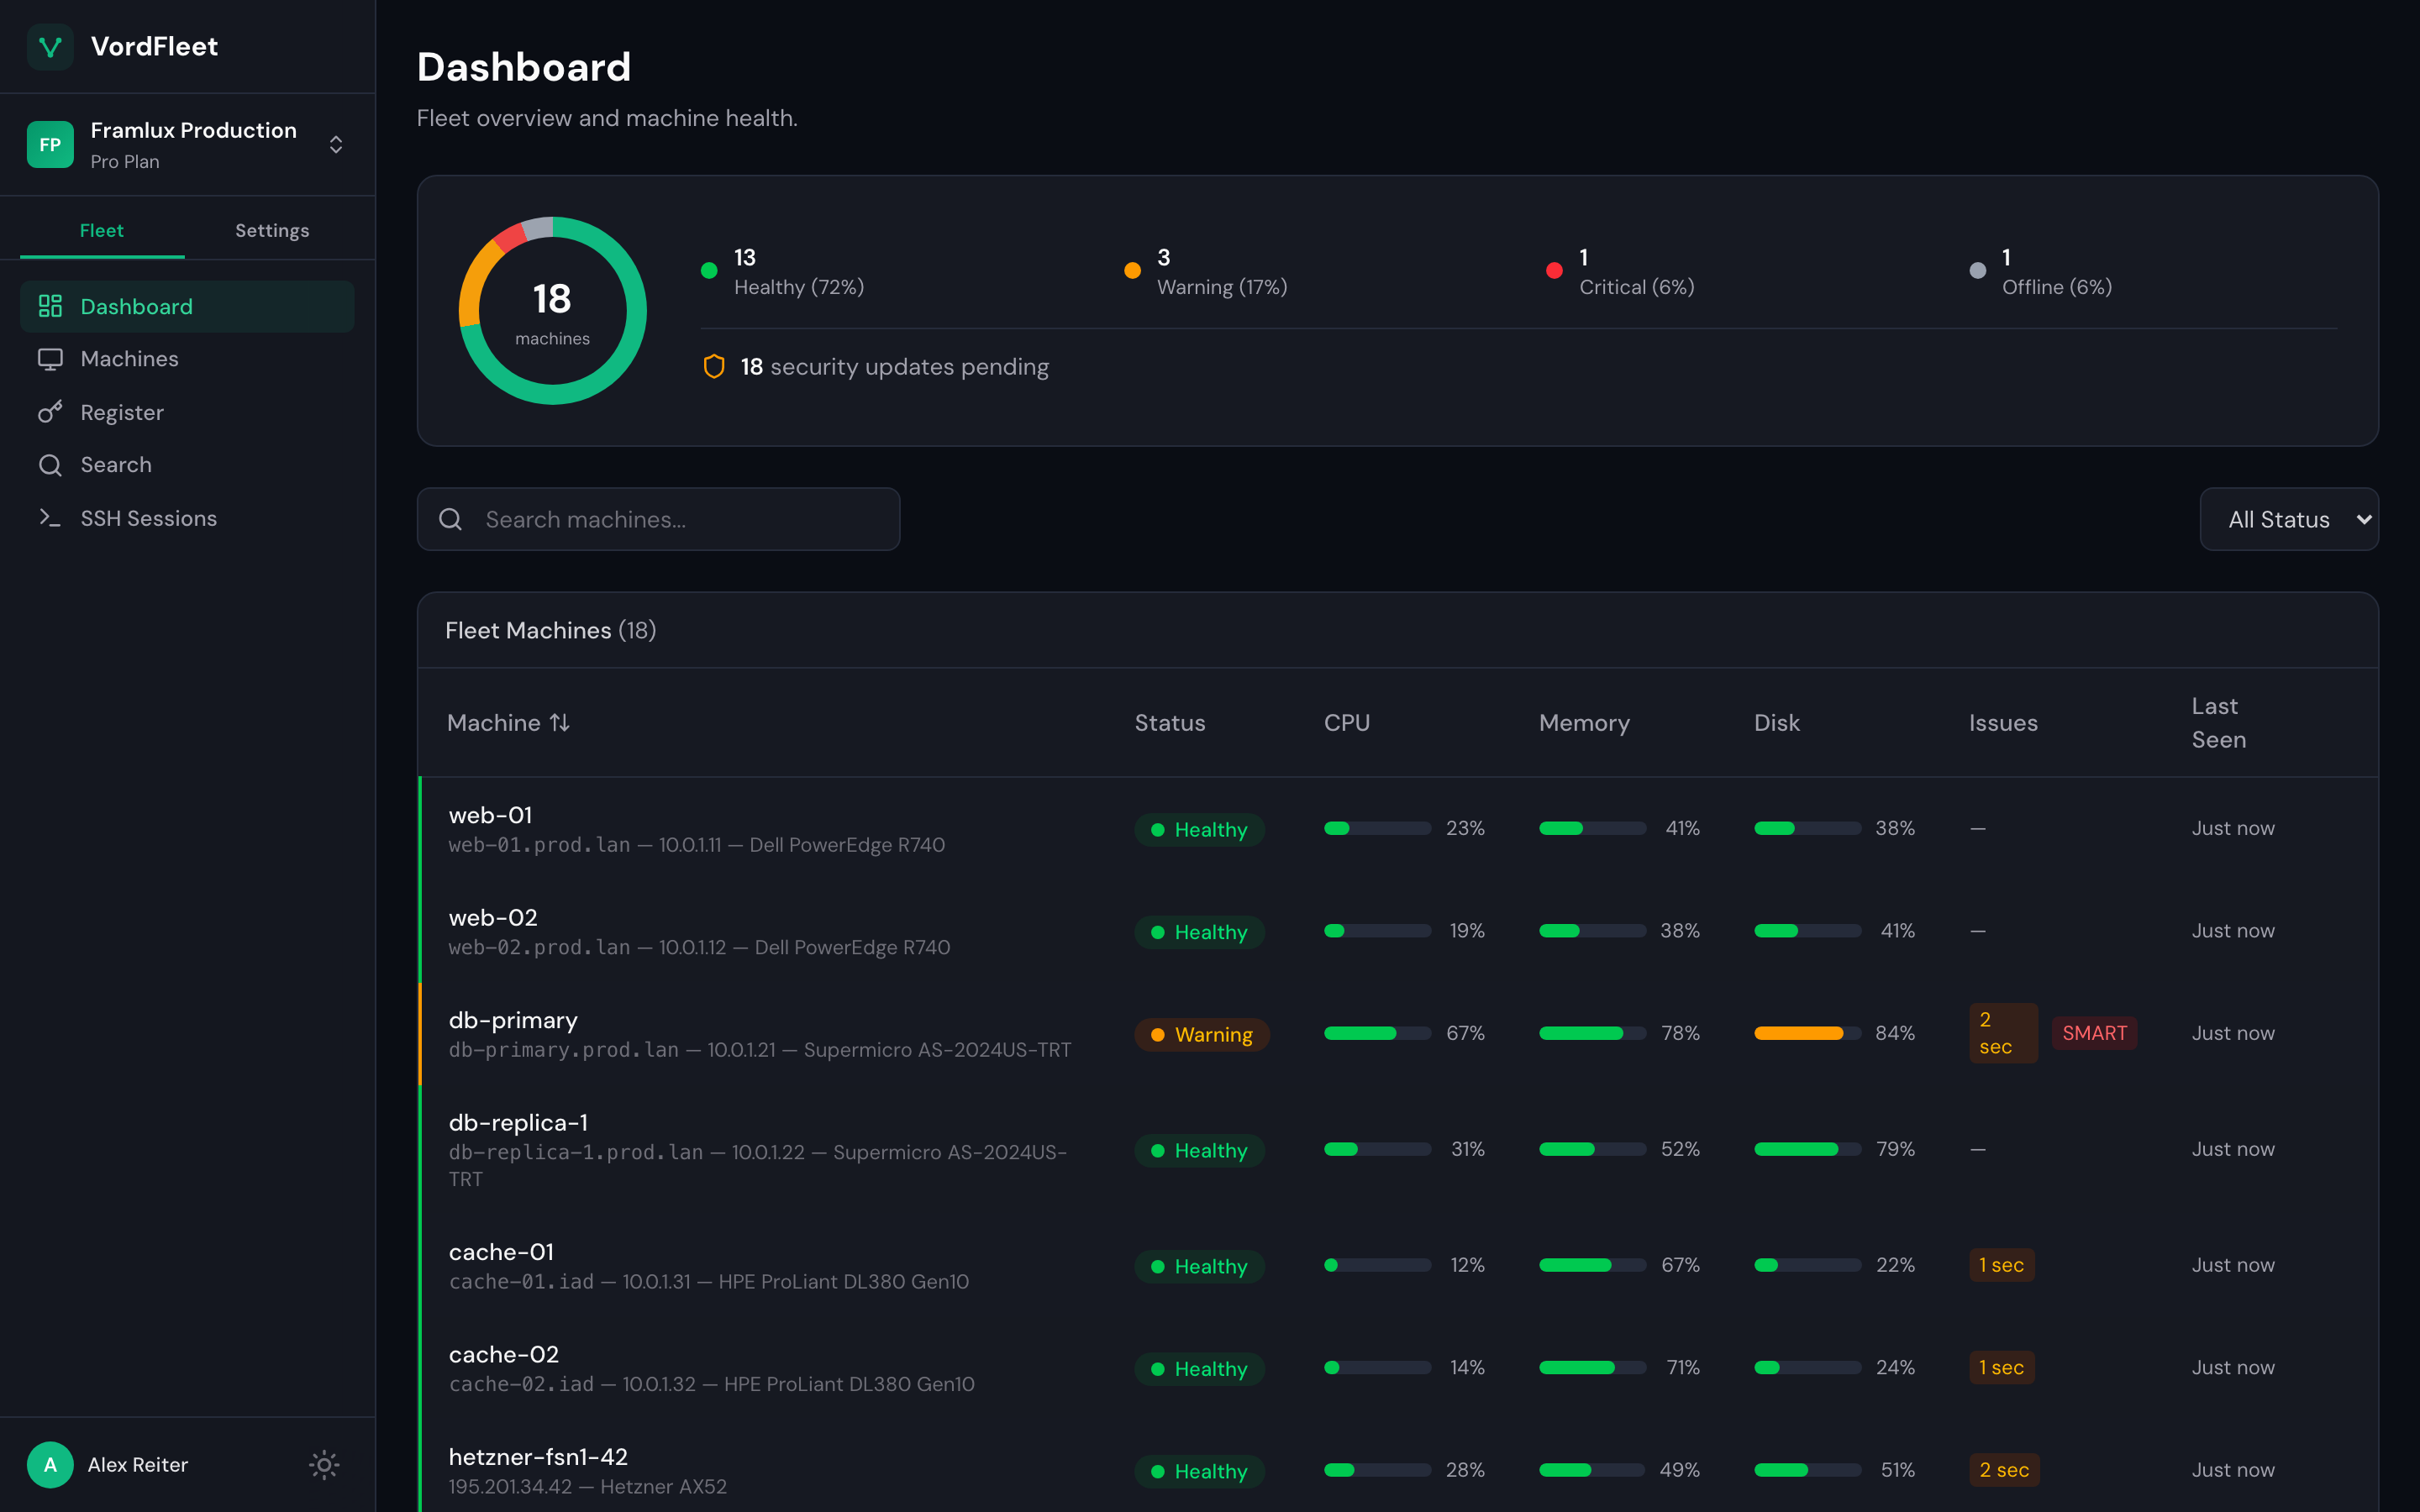
Hardware health and OS state,
in one screen.
Disks about to fail, boxes that just dropped, packages that need attention. Everything you'd ssh to check yourself, already collected.
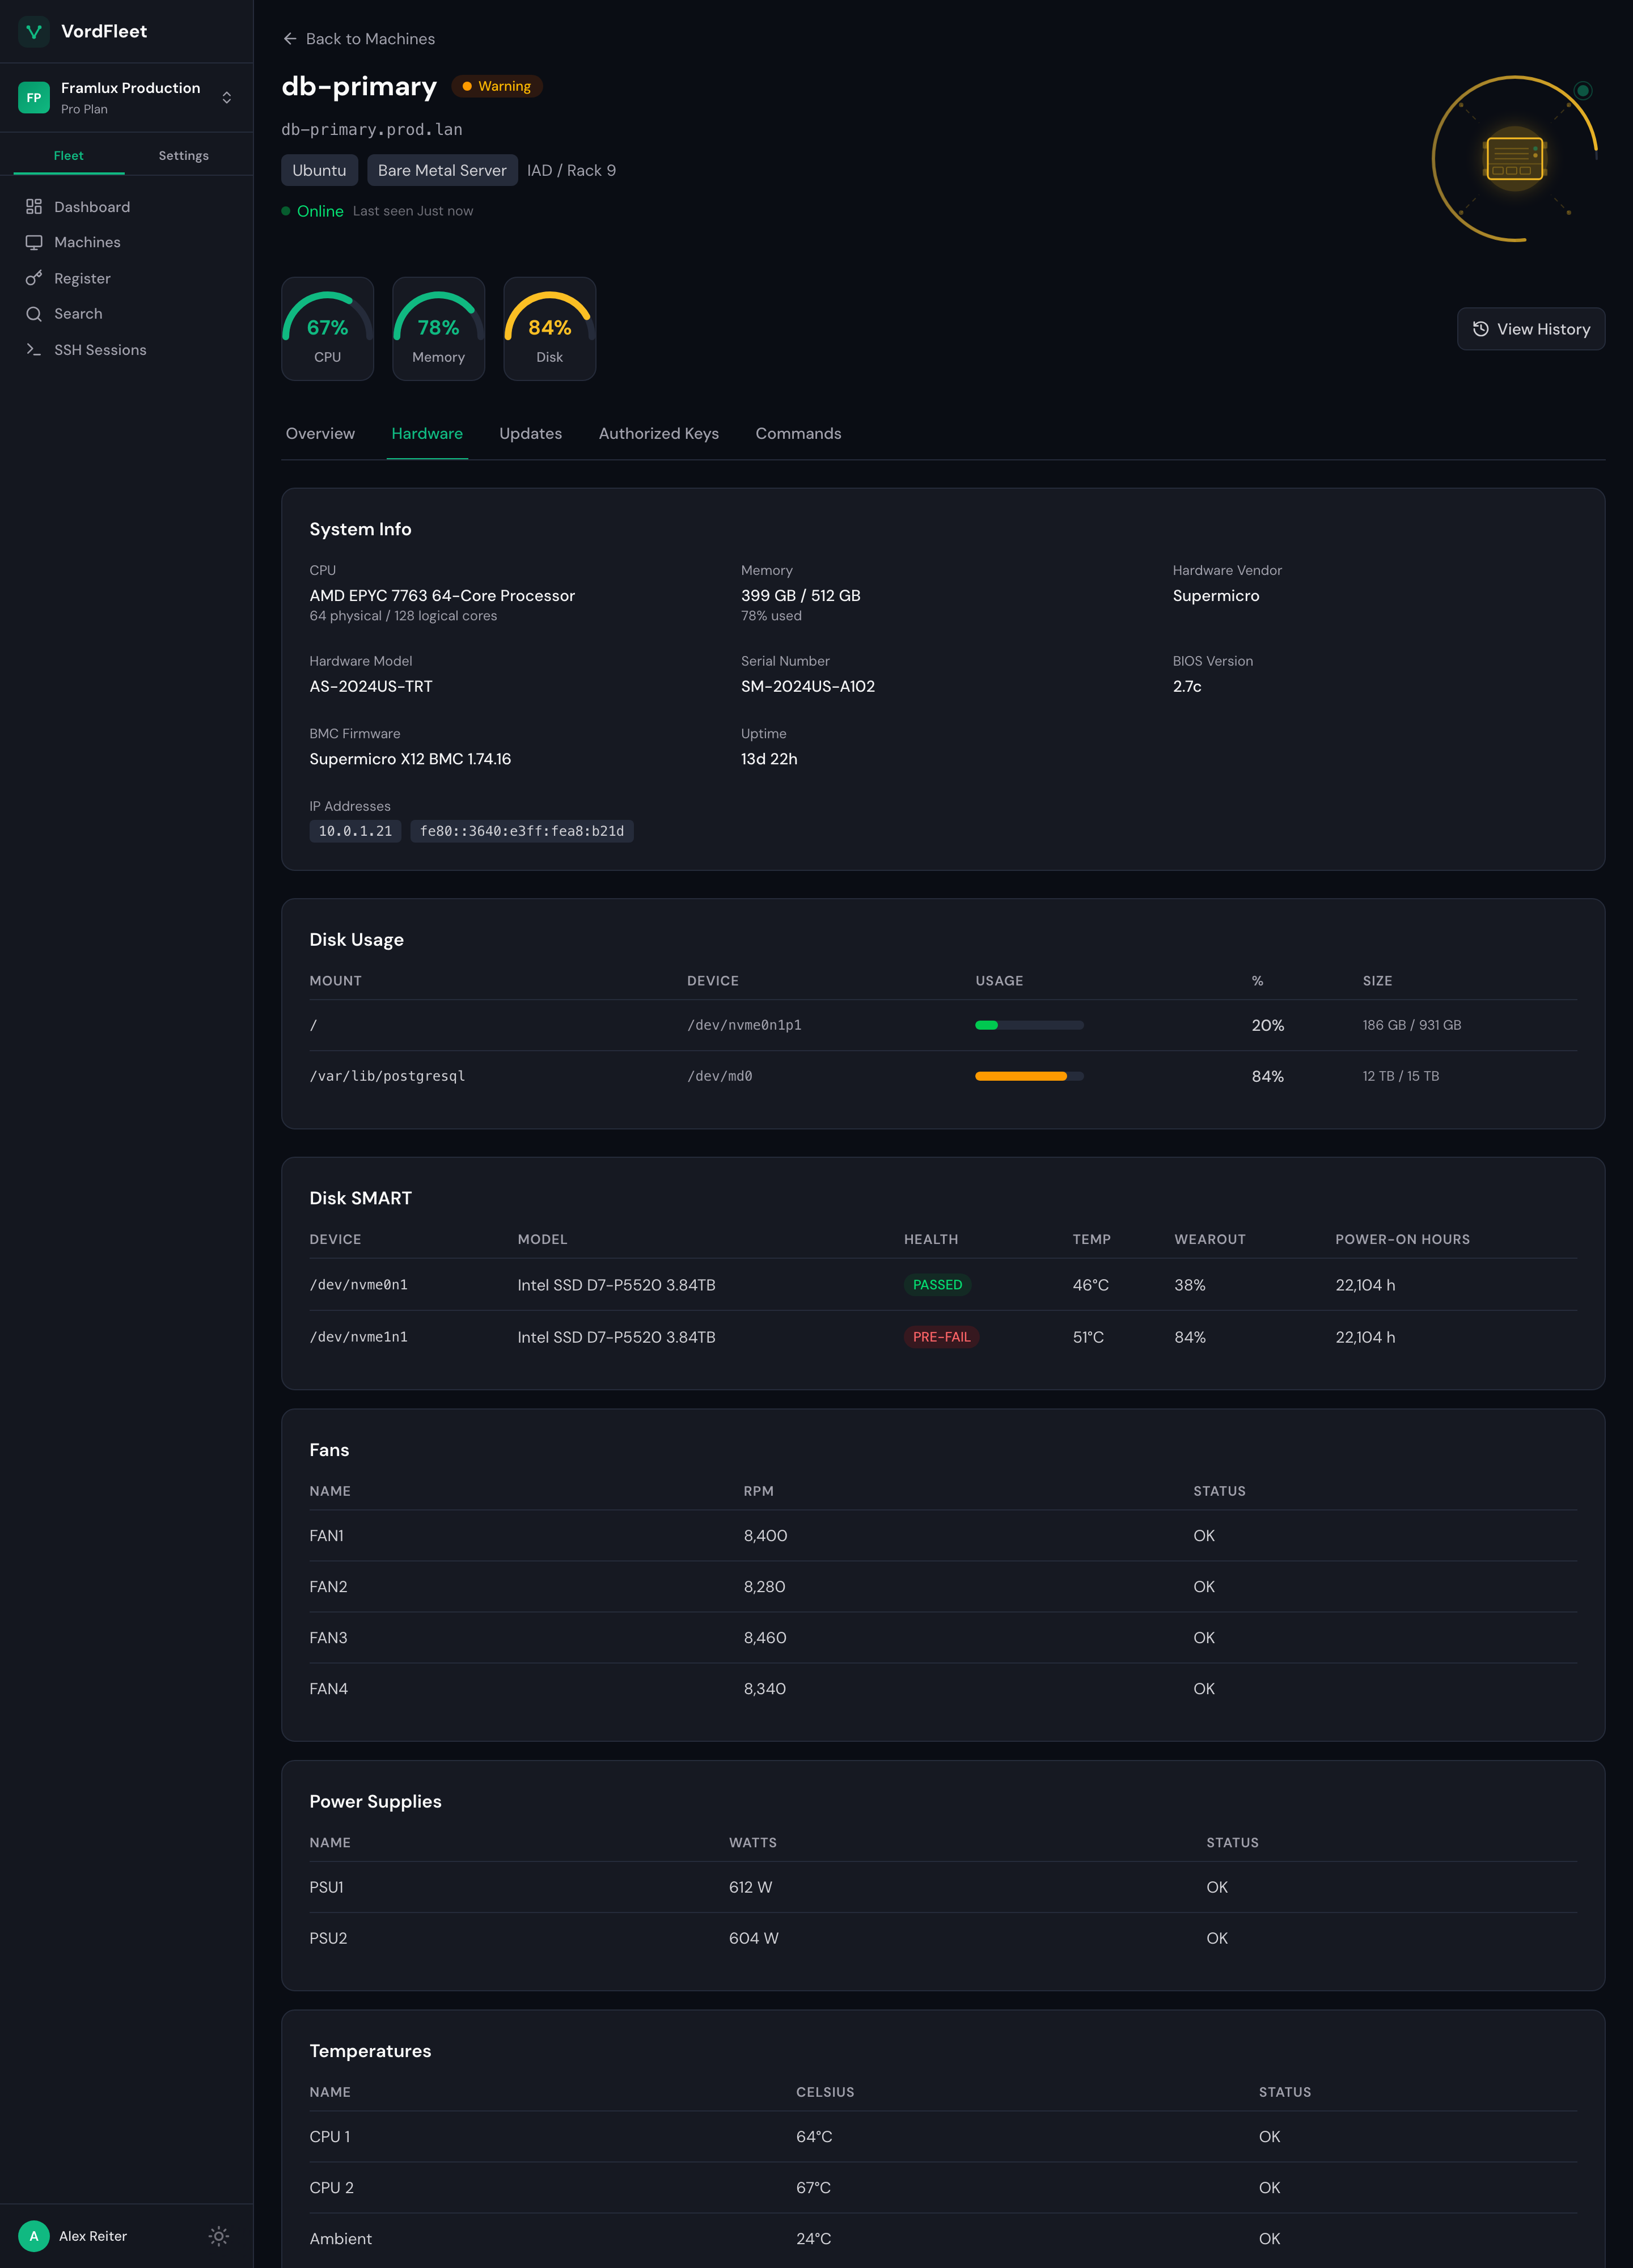
caught
db-primary's nvme1n1 hit 84% wearout. SMART pre-fail. Order the replacement on Tuesday.
Capabilities
What it actually does
Alerting without a query language
Built-in rules for the obvious stuff: disk failing, machine offline, temp rising. Custom thresholds on Pro. Emails and webhooks, not a query language.
Hardware health without a BMC
IPMI sensors, disk SMART, fan RPM, PSU status, thermals. Pulled from the OS, not the baseboard. No out-of-band network required. No IPMI-over-LAN. Just install the agent.
SSH and security events
See who's logged in, who sudo'd, and what packages changed. Not a SIEM. Just what you'd check manually after a page, already collected.
Hardware health
Disk pre-fail,
before downtime.
Disk SMART, fan RPM, PSU watts, every temperature sensor — pulled from the OS, no BMC required. When SMART flips to PRE-FAIL, the dashboard says so and the alert fires before the next reboot.
- Per-disk SMART status, wearout %, power-on hours
- Fan RPM, PSU status, every temperature sensor
- IPMI readings via the OS — no out-of-band network
Principles
What we believe
Operator-led, not sales-led.
I built VordFleet because I run servers, not because I sell monitoring. The roadmap comes from ops pain, not market research.
Hardware-first.
Most monitoring tools treat the server like a container host. VordFleet treats it like a physical thing with disks that fail and fans that stop spinning.
Your data is yours.
Every tier includes SQLite export. I will never lock you in. If you leave, your telemetry history leaves with you.
Honest about scope.
VordFleet is not Datadog. It's not trying to be. It does one job: fleet-wide hardware and OS visibility for bare-metal Linux. If you need APM or distributed tracing, use something else alongside it.
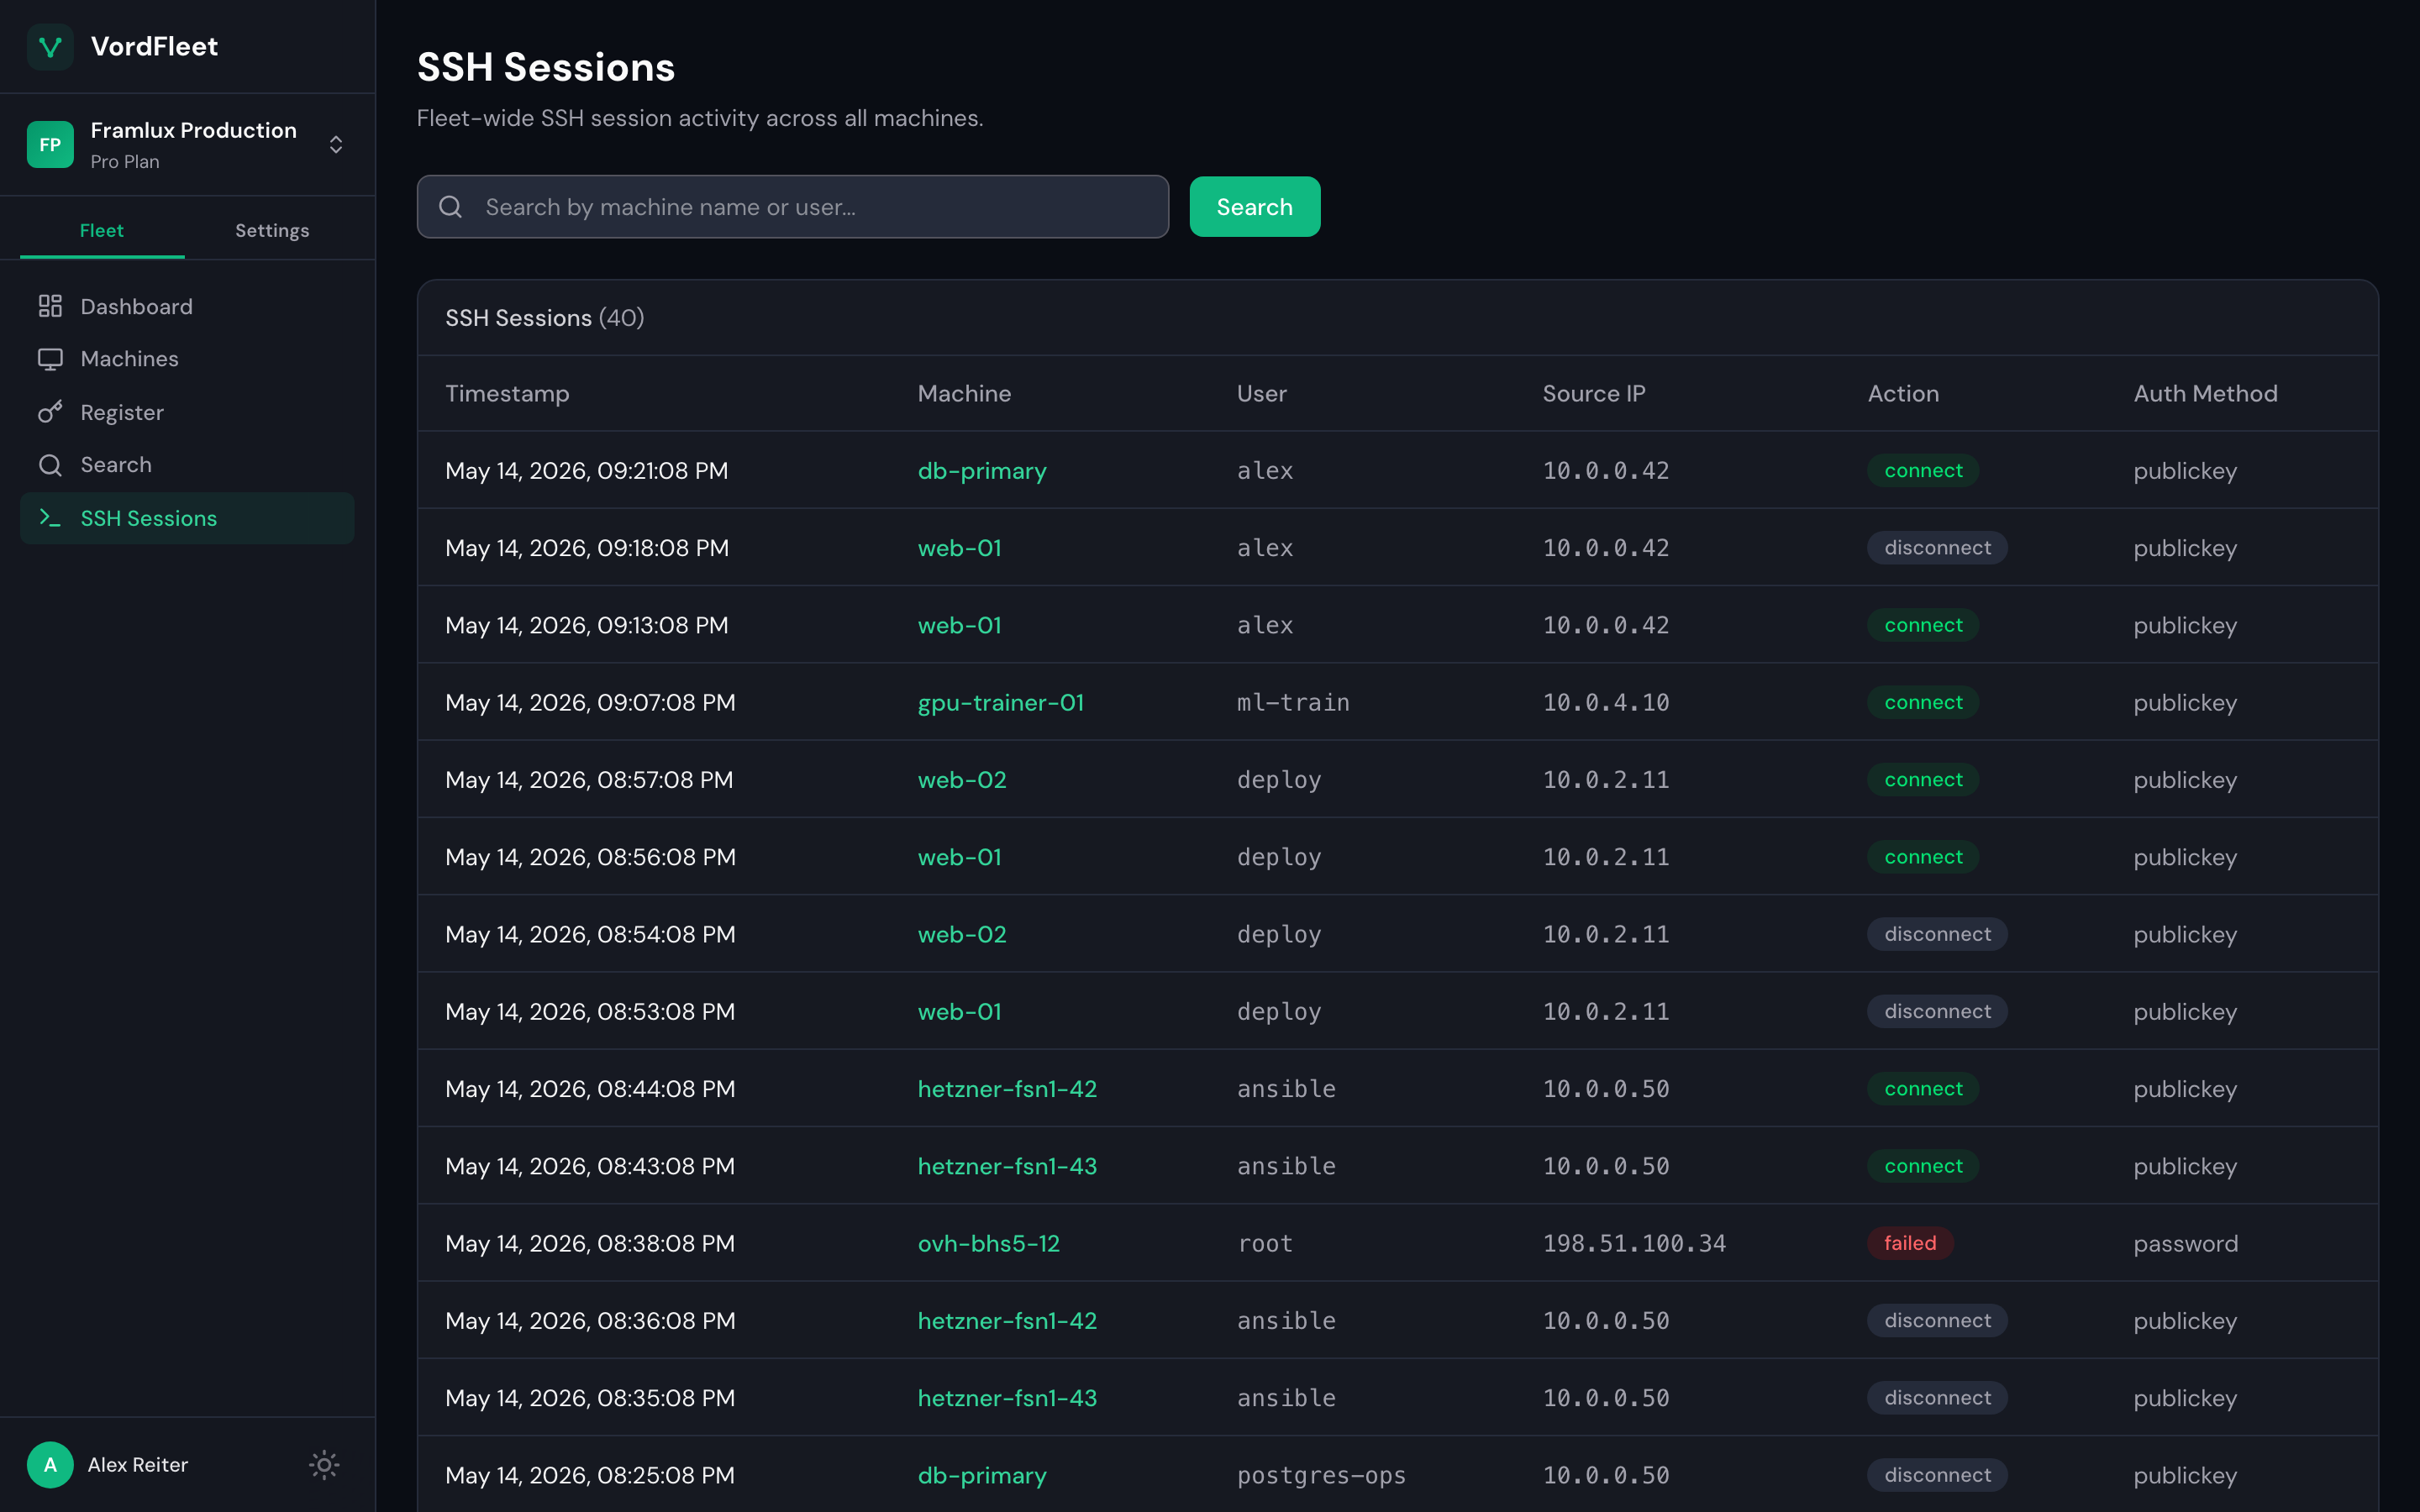
flagged
Failed root login over password auth from 198.51.100.34. Alerts fired automatically.
Activity
Who's on the boxes,
across the fleet.
Every SSH connect, disconnect, and failed login from every host, in one timeline. Source IPs, auth methods, sudo escalations — visible without ssh-ing into each box.
- Fleet-wide timeline, searchable by host or user
- Failed logins flagged, alerts via email or webhook
- Not a SIEM — just what you'd check manually, already collected
Alternatives
How VordFleet fits
Different tools for different jobs. Pick the right one.
DIY Prometheus + Grafana + node_exporter + smartctl_exporter
What I'd build if I had the time. Free, flexible, and a real time investment. If you enjoy operating your monitoring stack, this is the right answer.
Netdata
A full observability platform with deep agent-side metrics and ML anomaly detection. More powerful than VordFleet and more complex. If you want to drill into thousands of metrics per host, use Netdata.
Datadog and the other big SaaS platforms
Built for companies with cloud-native infrastructure and the budgets to match. The per-host pricing alone rules them out for most homelabs.
Checkmk and traditional enterprise monitoring
Mature, capable, and shaped for IT departments. If that's you, they're a reasonable choice.
VordFleet
What I built because none of the above were shaped for "I run a few bare-metal boxes and want a fleet dashboard without weekends of setup." Source-available, your data exports as SQLite, $5/host once you outgrow the free tier.
Pricing
Simple per-host pricing
No hidden fees. Scale as you grow.
Free
Kick the tires. 3 machines, no credit card, no time limit.
- Up to 3 machines
- 24-hour data retention
- Dashboard & monitoring
- Hardware health / SMART
- SSH session monitoring
- Social login
Pro
For when your homelab outgrows the free tier, or for small production fleets.
- Up to 1,000 machines
- 60-day data retention
- Everything in Free
- Invite unlimited team members
- Email alerting
- Webhook notifications
- Built-in alert rules
- Priority support
Team
I don't run my homelab with audit logs, but if you have auditors, this is for you.
- Up to 10,000 machines
- 1-year data retention
- Everything in Pro
- RBAC
- Custom OIDC (Okta, Azure AD)
- Audit log
- Custom alert rules
- Signed & secure remote commands
- SLA support (24h)
Enterprise
Talk to us if you need on-prem, custom contracts, or fleet sizes that don't fit a calculator.
- Unlimited machines
- Custom data retention
- Everything in Team
- RBAC
- Custom OIDC (Okta, Azure AD)
- Audit log
- Custom alert rules
- Signed & secure remote commands
- Custom hosting options
- Dedicated support
Stay in the loop
Be the first to know
Self-service plans are coming soon. Drop your email and we'll let you know the moment signups open.
No spam, ever. Just a one-time launch notification.
Compare
Compare Plans
| Feature | Free | Pro | Team | Enterprise |
|---|---|---|---|---|
| Hosts | Up to 3 | Up to 1,000 | Up to 10,000 | Unlimited |
| Users | 1 | Unlimited | Unlimited | Unlimited |
| Data Retention | 24 hours | 60 days | 1 year | Custom |
| Dashboard | Yes | Yes | Yes | Yes |
| Hardware Health / SMART | Yes | Yes | Yes | Yes |
| SSH Session Monitoring | Yes | Yes | Yes | Yes |
| Package Status | Yes | Yes | Yes | Yes |
| Social Login (GitHub/Google/Microsoft) | Yes | Yes | Yes | Yes |
| Team Invitations | No | Yes | Yes | Yes |
| Email Alerting | No | Yes | Yes | Yes |
| Webhook Notifications | No | Yes | Yes | Yes |
| Built-in Alert Rules | No | Yes | Yes | Yes |
| Custom Alert Rules | No | No | Yes | Yes |
| RBAC | No | No | Yes | Yes |
| Custom OIDC (Okta, Azure AD) | No | No | Yes | Yes |
| Audit Log | No | No | Yes | Yes |
| Signed & Secure Remote Commands | No | No | Yes | Yes |
| Custom Hosting Options | No | No | No | Yes |
| Support | Community | Priority | SLA (24h) | Dedicated |
Why VordFleet
I run a homelab. Nothing fancy. A handful of bare-metal boxes doing the things bare-metal boxes do. I wanted a single dashboard that told me when a disk was about to fail, when a fan was struggling, when a box went offline, without setting up a full observability stack for what's basically a personal project.
I knew the options. Prometheus and Grafana are great if you want to spend a weekend on it. The big SaaS platforms are priced for companies, not for me. The hardware-vendor dashboards only work if you stay on one vendor.
So I built the thing I wanted. VordFleet is what I run on my own gear. If you also run a small fleet of bare-metal Linux boxes and want something between "DIY Prometheus" and "enterprise observability platform," it might be what you want too.
FAQ
Frequently Asked Questions
Yes. The Free tier gives you full access for up to 3 machines with no time limit. No credit card required.
You pay $5/month for each machine in your fleet. Add a box, your bill goes up. Decommission one, it goes down. Prorated automatically. Annual billing is $50/host/year if you'd rather pay once.
You'll see an upgrade prompt when you try to approve a 4th machine. Your existing machines keep working. You just can't add more until you upgrade.
Yes. Cancel from billing settings. Your service runs until the end of the current billing period. No cancellation fees, no retention calls.
Retention is how long VordFleet keeps your telemetry history. Free keeps 24 hours. Pro keeps 60 days. Team keeps a year. Live data is always available regardless of tier. And you can export everything as SQLite at any time, on any plan.
On Pro and Team, admins invite users by email from Settings > Members. Invitees sign in with GitHub, Google, or Microsoft. Their email has to match the invitation.
Team is for organizations that need OIDC (Okta, Azure AD), role-based access control, and audit logging. $10/host/month, or $100/host/year with annual billing.